Virtual reality with UnityMol
Molecular visualization software packages provide the ability for users to explore the 3D representations molecular structures and properties. Typical user interaction is limited to panning, zooming, and rotating the molecule using a mouse and keyboard while viewing on a standard computing monitor. These techniques support a pseudo 3-dimensional view of a molecule to understand its structure but lack the true depth perception people are used to with stereoscopic vision in the real world.
New advancements in virtual reality (VR) technologies has resulted in lower costs and systems that are easier to use to many consumers. Compared to past VR hardware, these new systems have several key advancements including lower latency, higher frame rates, and improved resolution. Additionally, these systems are equipped with better optics and motion tracking and a more robust software ecosystem.
We are extending the visualization capabilities for APBS through the incorporation of a VR device with molecular rendering software. We are currently experimenting with the HTC Vive, which allows a person to walk around a 15’ by 15’ physical space while wearing a head mounted display. Precise head movements are matched in virtual reality with no noticeable latency. Additionally, the HTC Vive controllers are motion tracked with millimeter precision and provide a valuable method for interacting with virtual objects. We have enabled VR using the HTC Vive in the UnityMol molecular visualization software (created by Baaden, et al.) and incorporated electrostatic surface data (see figure below and a YouTube video). New viewing capabilities now include walking around, grabbing (using the motion controllers), and scaling (gestures) of molecules. We are actively working with Dr. Baaden and his group to determine the best use of interaction techniques for users to interact with molecular models through his software.
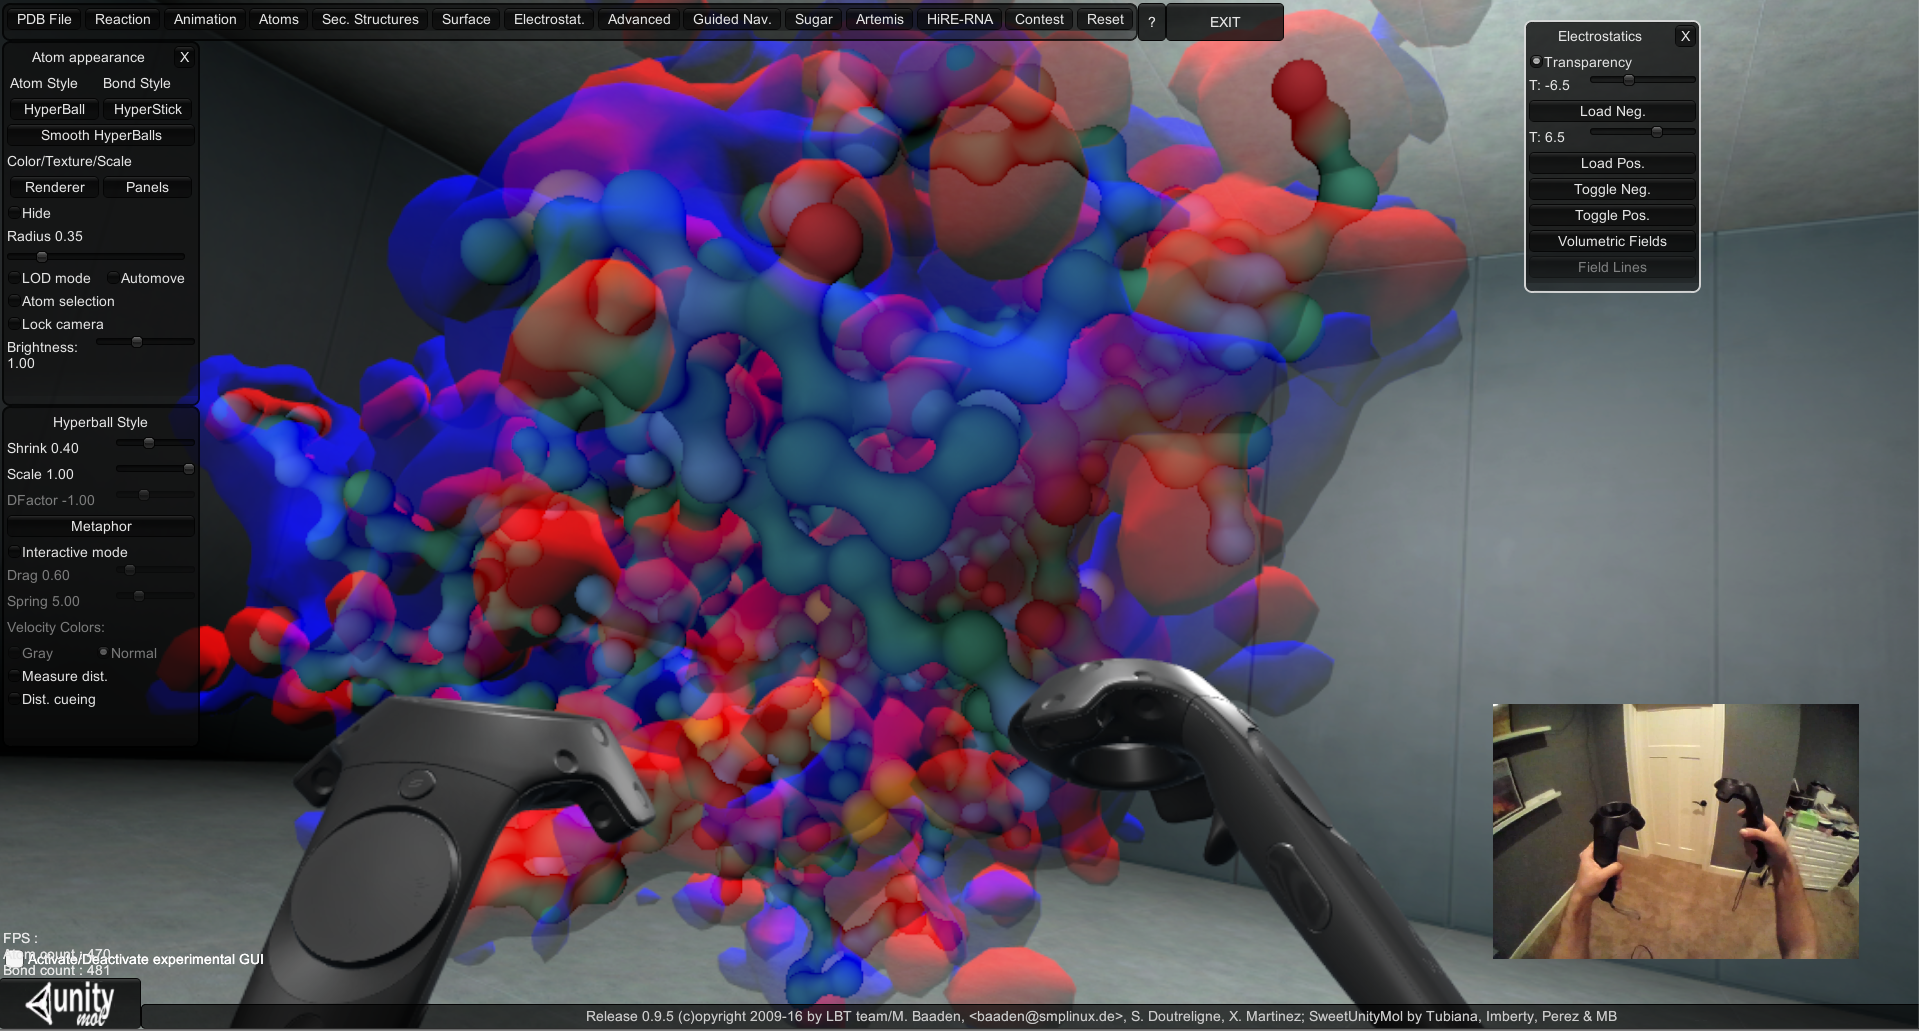
View of UnityMol form the monitor as it is being used in VR with controllers.
For future work, we would like to further extend UnityMol in the HTC Vive to include natural user interactions for viewing multiple molecules, vary the electrostatic results from APBS, and change molecular attributes. We envision this tool will also enable virtual collaboration for participant in different locations. Each participant will be able to view, gesture and interact with the same data in the same VR space. Finally, we would like to explore the use of VR for research related to docking of different molecules.
Getting the software
- Download
UnityMol-APBS-PS.zipfrom SourceForge. - Unzip
UnityMol-APBS-PS.zip; the resulting folder containsUnityMol-APBS.zipandAPBS-PDB2PQR.zip. Unzip UnityMol-APBS.zip; the resulting folder contains UnityMol.exe.- Optionally unzip
APBS-PDB2PQR.zipintoC:` to generate three directories :file:`apbs(containing apbs executable),pdb2pqr(containing pdb2pqr executable), andOutputFiles. Alternatively, these executables can be downloaded and installed separately.
Using the software
Launch UnityMol.exe UnityMol.exe to start the VR visualization. The user interface is illustrated below.
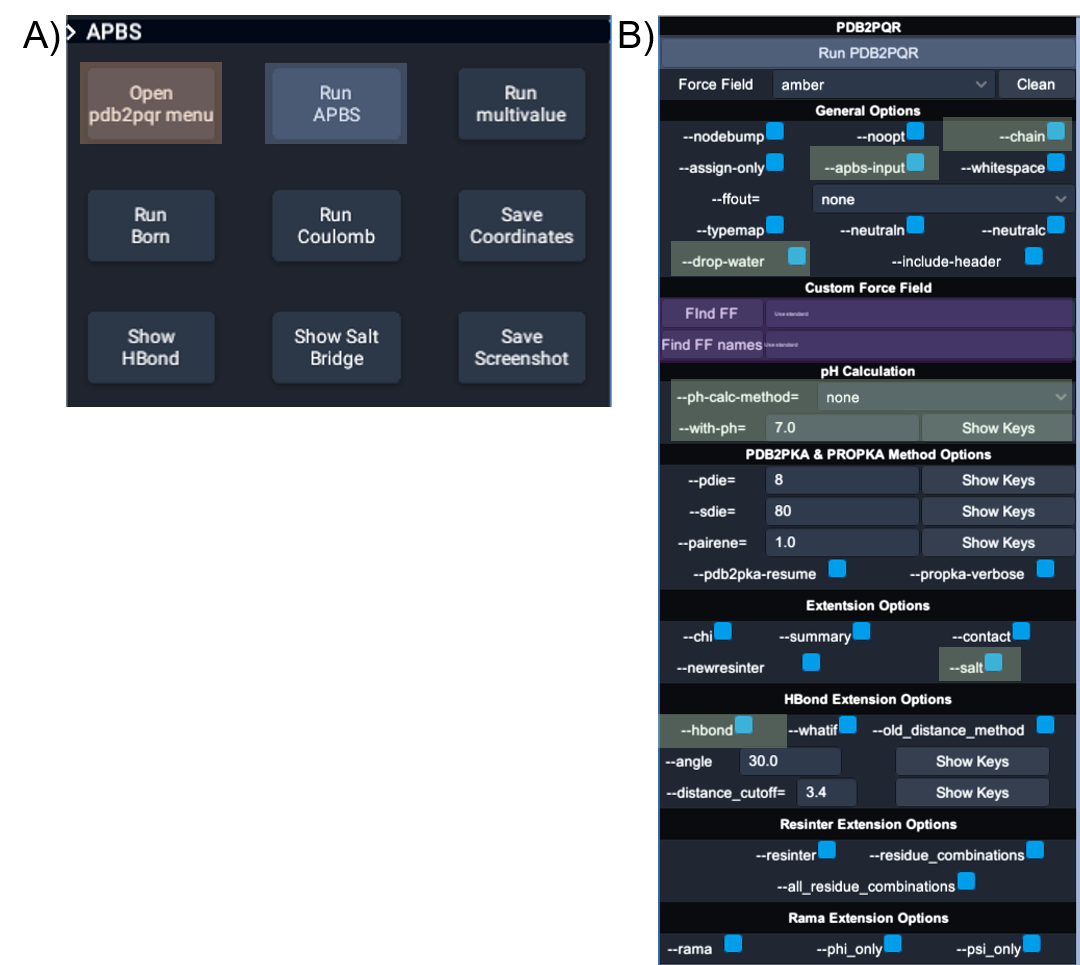
UnityMol-APBS user interface for PDB2PQR and APBS. (A) The main UnityMolAPBS menu; orange box highlights the two buttons used to open the APBS and PDB2PQR tools. (B) The main menu for interactions with APBS and PDB2PQR. Blue boxes show the buttons to launch PDB2PQR and APBS executables, green boxes show the location of the options used for producing the image in below, and the purple boxes highlight the two input fields required to use custom force fields and custom residue names.
Acetylcholinesterase example
The example illustrates the VR vizualization of the electrostatic surface potentials and electrostatic field lines of Torpedo californica acetylcholinesterase (AChE).
- Download
5ei5.pdbfrom https://www.rcsb.org/structure/5EI5 - Open UnityMol-APBS (VR or desktop)
- Load
5ei5.pdbfile - Open the PDB2PQR panel
- Choose options (examples below) or run the default (default force field is AMBER)
- apbs-input generates input file necessary for APBS
- drop-water removes explicit water molecules from structure
- summary writes atom names and sequence to a new file
- salt writes salt bridge donor and acceptor atoms to a new file
- hbond writes hydrogen bonding donors and acceptors to a new file. The resulting
.hbondand.saltfiles can be loaded as a new selection in UnityMol-APBS
- Select all(5EI5) and run PDB2PQR
5ei5X.pqris written to a file and is immediately loaded for the user.- Select
all(5EI5)and run APBS 5ei5X.dxis created and loaded into the selection all(5EI5X) automatically- Select the + button on the all(5EI5X) selection tab, then select surface
- Select color by charge
- Select the + button on the all(5EI5X) selection tab, then select field lines
As a result of these steps, you should see a figure similar to the following.
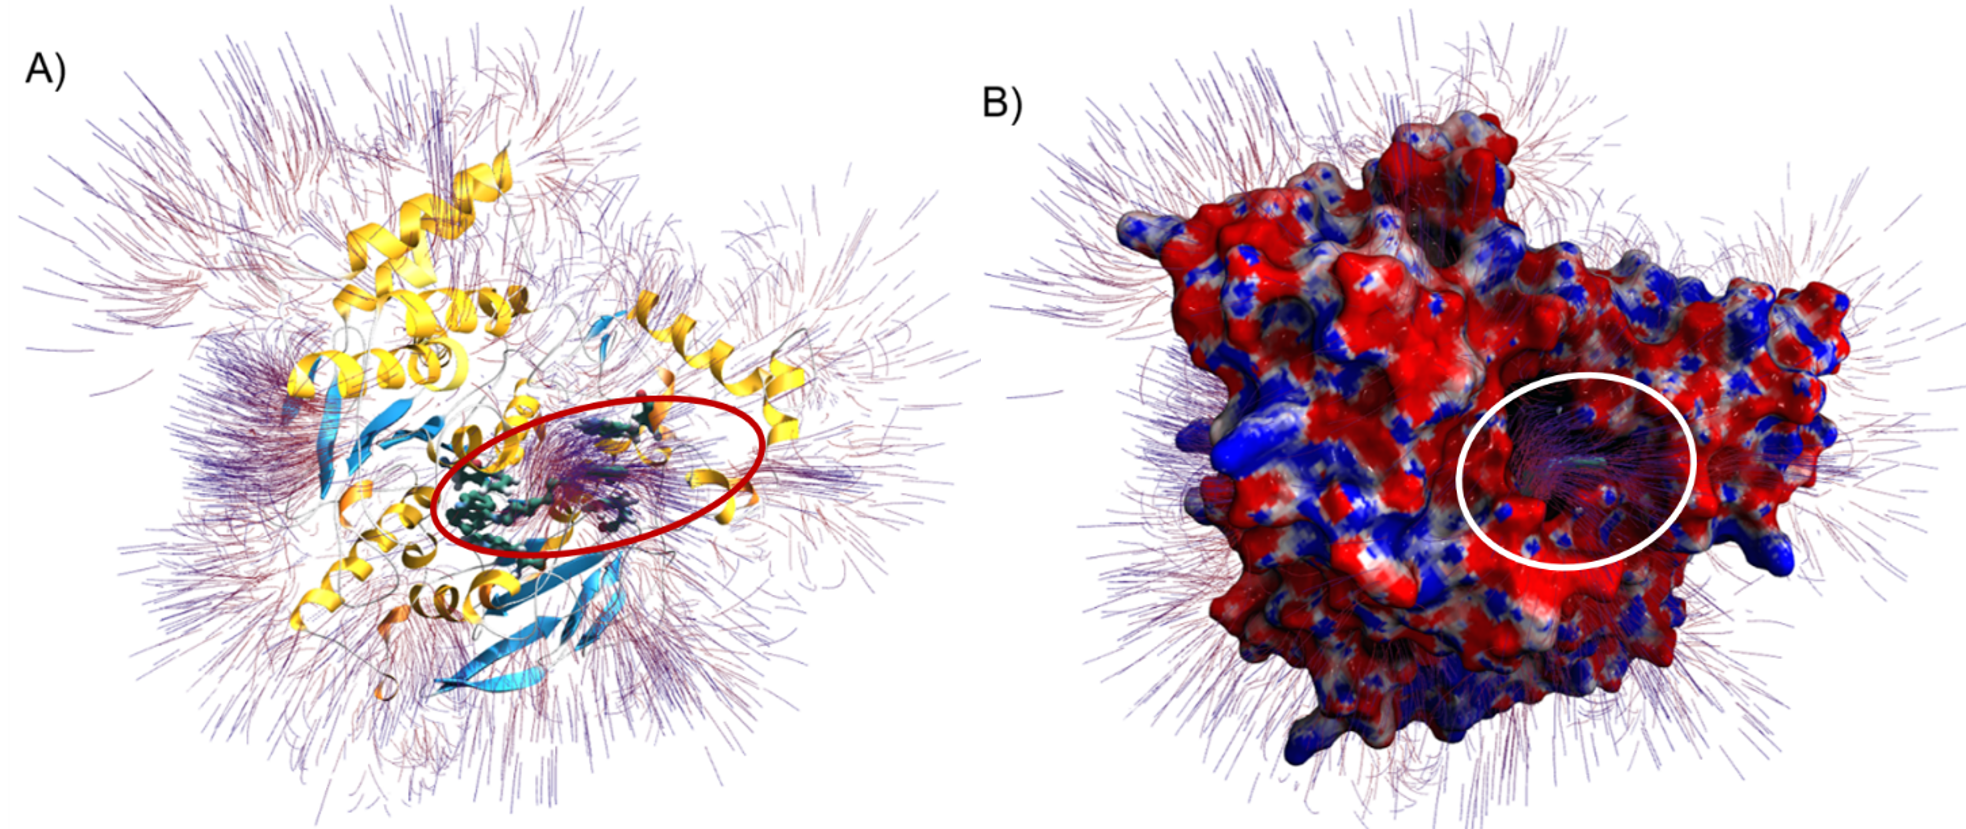
Electrostatic surface potential and field lines of Torpedo californica AChE (PDB ID 5EI5) with bound alkylene-linked bis-tacrine. (A) Electrostatic field lines and protein secondary structure shown with alpha helices (yellow), beta sheets (blue), and random coils (white). Residues Tyr70, Trp84, Trp279, and Phe330 are shown interacting with alkylene-linked bis-tacrine via hydrogen bonding and π-π stacking interactions. The red oval highlights the potential gradient. (B) AChE surface model with field lines and mapped electrostatic surface potentials shown with neutral, negative, and positive charges in white, red, and blue, respectively. Field lines are calculated from a gradient (value of 0.2) and depicted with the starting points in red and the ending points in blue. The orientation is the same in Figures A and B, where the alkylene-linked bis-tacrine can be seen occupying the catalytic gorge. The white circle highlights the potential gradient exiting the catalytic gorge.