VIsualization with PyMOL
The PyMOL molecular graphics software package can both run APBS and visualize resulting electrostatic potentials. Below are instructions for performing a basic demonstration of how to go from a PDB entry to a plot of structure and potential in PyMOL using APBS.
Run the APBS calculation
Load your PQR file you created into PyMOL (File → Open…) and choose your favorite graphical representation of the molecular structure.
Go to Plugin → APBS Tools… to open the APBS calculation plugin.
Under the Main tab of the PyMOL APBS Tools window, select Use another PQR and either browse to (via the Choose Externally Generated PQR button) or input the path to your PQR file. This step is necessary to ensure you use the radii and charges assigned by PDB2PQR.
Under the APBS Location tab of the PyMOL APBS Tools window, either browse to (via the APBS binary location: button) or input the path to your local APBS binary. It is not necessary to provide a path to the APBS
psize.pybinary for most biomolecules.Under the Temporary File Locations tab of the PyMOL APBS Tools window, customize the locations of the various temporary files created during the run. This can be useful if you want to save the generated files for later use.
Under the Configuration tab of the PyMOL APBS Tools window, press Set grid to set the grid spacings. The default values are usually sufficient for all but the most highly charged biomolecules.
Under the Configuration tab of the PyMOL APBS Tools window, customize the remaining parameters; the defaults are usually OK.
Note
0.150 M concentrations for the +1 and −1 ion species are often useful to ensure that electrostatic properties are not overly exaggerated.
Under the Configuration tab of the PyMOL APBS Tools window, press the Run APBS button to start the APBS calculation. Depending on the speed of your computer, this could take a few minutes. The Run APBS button will become unselected when the calculation is finished.
Visualize the results
Before proceeding, you must load the electrostatic potential data into PyMOL. Under the Visualization tab of the PyMOL APBS Tools window, press the Update button.
Electrostatic isocontours
PyMOL makes this step very easy: adjust the positive and negative “Contour” fields to the desired values (usually ±1, ±5, or ±10 kT/e) and press the Positive Isosurface, Negative Isosurface, and Show buttons.
At this point, you probably have a figure that looks something like the image below.
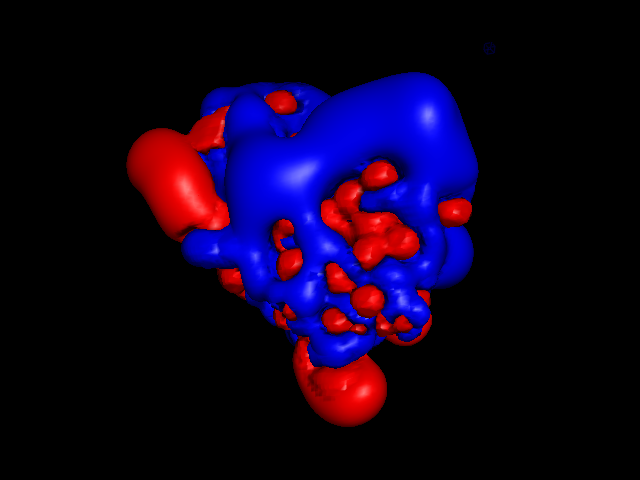
±1 kT/e electrostatic potential isocontours of FAS2 in PyMOL
If the colors are not as you expect, you can change the colors of the objects iso_neg and iso_pos in the main menu. By convention (for electrostatics in chemistry), red is negative (think oxygen atoms in carboxyl groups) and blue positive (think nitrogen atoms in amines).
Surface potentials
If you haven’t already, hide the isocontours by pressing the Positive Isosurface, Negative Isosurface, and Hide buttons. The surface potential is also straightforward to visualize. Set the “Low” and “High”values to the desired values (usually ±1, ±5, or ±10 kT/e) at which the surface colors are clamped at red (-) or blue (+). Check the “Solvent accessible surface” and “Color by potential on sol. acc. surf.” buttons to plot the potential on the solvent-accessible (probe-inflated or Lee-Richards) surface. Press the Molecular Surface Show button to load the surface potential.
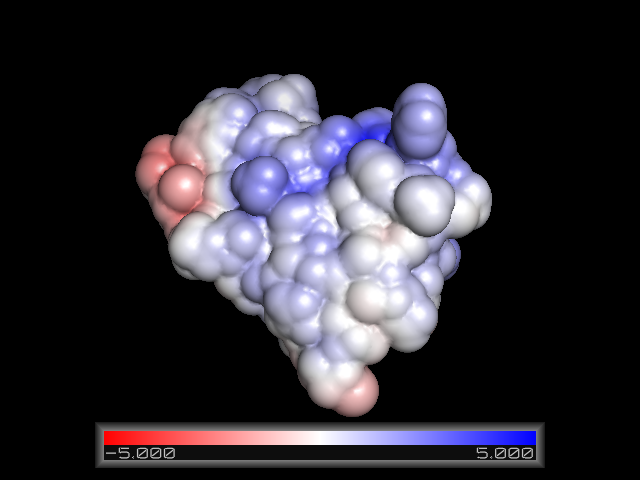
±5 kT/e electrostatic potential of FAS2 in PyMOL plotted on the solvent-accessible surface.
The solvent-accessible surface tends to reveal more global features of the surface potential. Tighter surfaces (e.g., van der Waals and molecular or Connolly surfaces) provide more information about the shape of the biomolecule but otherwise tend to simply map atomic surface charges onto the biomolecular surface. PyMOL can simultaneously provide geometric information (from the molecular surface) and useful electrostatic potential information (from the solvent-accessible surface). To visualize the molecule in this way, simply uncheck the “Solvent accessible surface”box and check the “Color by potential on sol. acc. surf.” box on the Visualization tab.